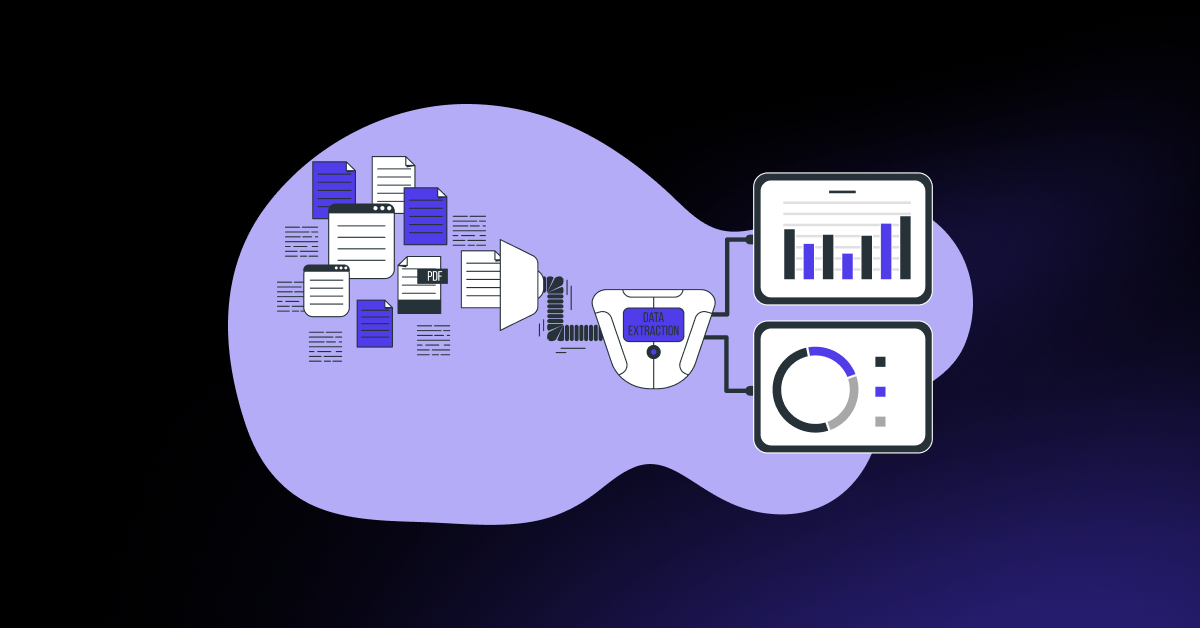
A chart appears to support the point you want to make. The number is clear, the source looks credible, and the deadline is close. Before you include it, there is another question to settle… does the figure actually measure the subject the reporter asked about?
Public data gives you useful evidence without commissioning a survey, provided you understand what it describes. Your expert contribution comes from interpreting that evidence accurately and explaining its relevance. The strongest response combines a traceable finding with informed judgment.
Getting there means checking definitions, making fair comparisons, and drawing a clear boundary between the published result and your own conclusion.
Start With the Reporter’s Question
Identify the issue the journalist is investigating before searching for a figure. A request about recruitment difficulty, for example, is different from a request about the number of people employed. Related measures do not automatically answer the same question.
Write down the question you need the data to answer and the knowledge you bring to it. This keeps the research focused. If no suitable evidence exists, narrow the claim or provide a clearly identified professional observation instead of selecting the most dramatic number available.
Find the Original Release and Its Definitions
Follow a statistic back to the organization that collected or published it. Read the release notes and locate the underlying table where possible. A secondary article might omit the population, period, or qualification that made the original statement accurate.
Record the publication date separately from the period measured. Recent publication does not mean the data describes this week’s conditions. Check whether the figure is provisional, revised, seasonally adjusted, or drawn from a sample; those details affect how you can explain it.
When the evidence comes from a survey, examine who was asked and how respondents were selected.
Compare Measures That Belong Together
Check the units, population, geography, and time period before making a comparison. A national average and a figure from a selected city describe different groups. Likewise, revenue, profit, and transaction volume tell different stories even when they all rise or fall.
Public data often carries explicit comparison guidance. The U.S. Census Bureau’s ACS guidance warns against comparing overlapping multiyear estimates and incompatible estimate periods. It also explains that estimates include uncertainty. Read the guidance attached to the particular dataset you are using before assuming every available column belongs in the same calculation.
Apply the same discipline to percentages. A change in percentage points differs from a relative percentage change. Recheck the arithmetic and label the measure accurately. If your explanation becomes difficult to defend in plain language, pause before turning it into a confident headline or quote.
Explain What Your Experience Adds
The dataset establishes the observed result within its scope. Your expertise should help readers understand a possible implication, practical consideration, or limit. Keep those roles separate in the wording so the journalist knows what is sourced and what is interpretation.
For example, public information about business openings could provide context for a consultant discussing operational planning. It would not, on its own, prove why individual businesses opened or whether they will succeed. Your experience can identify questions owners should examine without claiming the dataset established a cause.
Stay within your verified expertise. A publicly accessible spreadsheet does not make you a specialist in every field it covers. If the analysis requires methods you do not understand, involve an appropriately qualified analyst or use a simpler, accurately described observation.
Let the Journalist Check Your Work
Include a direct source link and enough identifying detail to locate the relevant table or release. If you performed a calculation, explain the inputs and method. A saved working sheet helps you answer follow-up questions without reconstructing the analysis from memory.
State who produced the original public data. Describe your own work as analysis when that is what you did. Avoid calling another organization’s dataset your proprietary research or implying that you collected the underlying responses.
If you publish an explanation on your website, choose a reference page that contains the method, source links, and limitations. The journalist decides which source to cite. Your page earns consideration through useful analysis and transparency; access to an already public dataset does not entitle your business to a backlink.
Keep the Claim Accurate as the Data Changes
Record which release you used and when you accessed it. Some datasets are revised after initial publication, and a pitch prepared earlier might no longer reflect the current release. Check for updates before submitting the response or repeating its conclusion elsewhere.
If a revision materially affects your statement before publication, tell the journalist promptly and provide corrected wording with the updated source. Explain the difference clearly so they can decide how to handle it. Do not silently replace a working file and assume the reporter will notice.
Maintain the same care after coverage appears. Correct your own supporting page when necessary and contact the publication if the published explanation becomes materially inaccurate. A routine release update does not invalidate every historical statement, so distinguish an accurate description of an earlier period from a claim that was wrong when made.
Make Your Evidence Easy to Trust
Public data works best when it helps you answer a precise question and gives the reader a traceable foundation for your explanation. Use the right measure, preserve important limitations, and identify your interpretation honestly. Those habits make the response easier to inspect and harder to misunderstand.
They also support the source relationships that careful contributions build over time. Reporters can return to an expert who explains where an answer came from.
Ready to develop evidence-backed commentary for relevant publications? Reach out to today to discuss expert outreach, earned media mentions, and editorial backlinks built around your knowledge and properly supported insights.
FAFrequently Asked Questions
1. Can You Use Government Datasets in a Pitch?
Yes, when the dataset is relevant and you follow its applicable usage terms. Attribute the source, check its definitions, and explain the period covered. Public availability does not remove the need to interpret the information carefully.
2. Does Publicly Available Data Count as Your Original Research?
The underlying data belongs to its identified source. Your analysis might provide an original contribution, but describe that distinction accurately. Explain the calculations or interpretation you added without claiming you collected information produced by another organization.
3. Should Every Response Include a Statistic?
No. Use a figure when it answers the question or supports a relevant explanation. Firsthand experience and clear reasoning also have value. An unrelated number can distract from the contribution the journalist actually needs.
4. What If Two Sources Report Different Figures?
Compare their definitions, populations, dates, and methods before choosing between them. The difference could reflect what each source measured. Explain any unresolved discrepancy instead of selecting the figure that makes your preferred argument stronger.
5. Can You Ask the Journalist to Link to Your Analysis?
You can offer the page when it provides a useful explanation or reproducible method. Let the journalist choose the appropriate citation. Keep the original source available so readers can distinguish the underlying evidence from your interpretation.